Tag Sports

USA Soccer
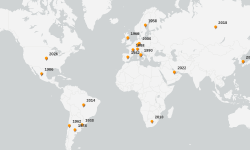
FIFA World Cup
Best Soccer Cities in the USA
What are the best soccer cities in the USA? One way to judge this would be to look at how many leagues (MLS, NWSL, and USL) have teams in a particular city. Running through the map, here’s the current list.
Shotcharts Revisited - From NBA Stats to Feature Service in Less Than 20 Lines of Code
About two years ago, I wrote about creating shotcharts in ArcGIS using Python and arcpy. With recent enhancements to the ArcGIS API for Python, I can do this all in Python and I can to this in less than 20 lines of code! (A guest post by Gregory Brunner)
St. Louis Bike Trails with Open Data from Great Rivers Greenway
2016 was a year of biking for my wife and me. We biked many trails in St. Louis, and even did part of the Katy Trail. So when I saw St. Louis City alderman Scott Ogilvie tweeting about Great Rivers Greenway, the trails organization in the St. Louis area, I started wondering what the future of St. Louis trails will be.
How to Create Pitch Charts with Python
I have been interested in looking at MLB pitch data and play-by-play for a while now, however, I have not found any good blog posts or tutorials for doing this. So during the MLB Playoffs, while I was checking the score of Cubs vs. Dodgers Game 5 on Yahoo! it struck me that there is probably a way to get the live game data from Yahoo! while the game is in progress. So I poked around and found that there is! In this post, I will review what I found and how to use the data to make pitch charts using the data from World Series Game 7. (A guest post by Gregory Brunner)
OKSCAUG, Thunder Up!
For OKSCAUG I was asked to give a short 10-15 minute overview during the morning and a longer technical session in the afternoon. Below, I have linked to the presentations. (A guest post by Gregory Brunner)

St. Louis Blues (NHL) Themed Map
Mapping NBA Player Movement in 2D and 3D
For this post, I’m going to describe some approaches to visualize an entire game of movement data with common GIS techniques and tools and use some really cool GIS visualization techniques to display the data and compare player movement maps. (A guest post by Gregory Brunner)
The Geography of Basketball, Part II: Watching the Game in ArcGIS
I wasn’t planning on writing another blog on this topic so soon, but a few days ago I was looking into how to turn the “gameid” field in the NBA data into the actual game date, teams involved, etc., and I stumbled upon this. (A guest post by Gregory Brunner)